
Archive for the ‘Agile’ Category
Boost.Test Tutorial Sample Code
Given the fact that people seem to have found my short Boost.Test tutorial, I thought they might appreciate having access to the sample code. So I have cleaned up the code, added a README, and created a repository for it on GitHub:
http://github.com/jsankey/boost.test-examples/
The easiest way to access the code if you have git is to clone:
$ git clone git://github.com/jsankey/boost.test-examples.git
If you don’t have git, you can download a zip or tarball from GitHub.
Happy testing!
Agile: Methodology With Another Level of Indirection
Despite the natural desire to find the “perfect” software development methodology, the simple fact is there is no one-size-fits-all solution. This led me to wonder: are so-called “agile” methodologies just a passing trend? Knowing that there is no silver bullet, can agile really be considered different to trends that have come before?
In fact, I think there is something different about the agile way. The problem of finding the perfect method has been solved in the same way we solve everything in programming: by adding another level of indirection.
Take the Agile Manifesto:
We are uncovering better ways of developing software by doing it and helping others do it. Through this work we have come to value:
- Individuals and interactions over processes and tools
- Working software over comprehensive documentation
- Customer collaboration over contract negotiation
- Responding to change over following a plan
That is, while there is value in the items on the right, we value the items on the left more.
I read this of a recognition of the fact that the two toughest parts of software development are:
- Dealing with people (communication, collaboration); and
- Coping with change (rather than pretending you can avoid it).
These challenges have been and always will be the key to successful projects. By defining agile in terms of these fundamental challenges, rather than specific practices, it can adapt to different circumstances. In fact, thanks to this abstraction, it is not really accurate to think of agile as a methodology — it is much more about culture than specific tools or practices.
The problem with this indirection, however, is it doesn’t give people an easy answer. If you want to try agile, where do you start? There is no secret here: the answer is simply to try things out and see what works. Just remember:
- If something works, that’s great, but don’t become complacent. No practice is perfect, always aim for improvement.
- If something doesn’t work, think about why. Can you tweak it? Has it run its course? There are no “best” practices: if you give something a proper chance and it doesn’t fit your team, cut it loose.
Put another way, the “secret” to agile is it is constant refactoring — of the process itself.
Pulse 2.0.32: Custom Continuous Integration Trend Reports
I’ve just released another Pulse 2.0 build, and the new features are still coming ![]() . In this case, I have added the long-anticipated ability to capture custom metrics with your build results, then report trends for these metrics over time. You can capture any benchmark of your build that you can imagine, then have Pulse chart it for you. All sorts of charts are supported, with flexible configuration.
. In this case, I have added the long-anticipated ability to capture custom metrics with your build results, then report trends for these metrics over time. You can capture any benchmark of your build that you can imagine, then have Pulse chart it for you. All sorts of charts are supported, with flexible configuration.
As an example, imagine capturing some simple performance measures as numbers. You can then configure Pulse to show them in a line chart:

Pulse stores the metric values with each build, so you can easily see how performance is changing over time:

Most importantly, if performance drops, it is easily visible exactly when it happened, making it much easier to figure out why. You can learn more about how to configure custom reports in the Cookbook.
As part of this change, I also tweaked the default reports that Pulse generates for you. Now all of these reports are configured in the same way as the custom ones above, allowing you to change them to suit your preference. Not only that, but more reports come “out of the box”:

Sweet! Interested in continuous monitoring of your project’s performance? Try Pulse 2.0 today with a free small team, open source or evaluation license.
You Break (the build), You Bought It
The Pulse 2.0 feature train keeps on rolling. Latest stop: using Pulse to communicate responsibility for a build.
Breaking the build is something to avoid, but even more important is the reaction when it inevitably does break. The key is fixing it fast, before it starts breaking the team’s flow. The worst possible scenarios are:
- Everyone assumes somebody else is responsible, so nobody fixes it. The build stays broken.
- Multiple people assume responsibility without talking to each other. Effort is wasted as they all work on fixing the same problem.
Both of these scenarios can be fixed by the same solution: communication. Responsibility for fixing the build needs to be taken by one person, quickly, and communicated to the rest of the team. If nobody has taken responsibility, everyone needs to be aware.
Pulse now supports this directly via the take responsibility feature. When you see the build is broken, you can click a link to take responsibility, optionally adding a comment:

Everybody can see who is responsible, both on the project home page, and the summary pages for all builds for the project:

Only one person can be responsible at a time, so there’s no confusion. It’s up to the person responsible to decide when their job is done — although you can optionally have responsibility automatically cleared when a build completes successfully (a pretty good indicator that it’s fixed!).
So, start communicating today, and stop wasting time! You can download Pulse and try a free evaluation today. Happy building!
Boost.Test XML Reports for Continuous Integration
Following on from my Boost.Test primer, the key goal for me was test result reporting in a continuous integration server1. To support this, I needed to produce output from Boost.Test which I could easily consume in a plugin. As it happens, Boost.Test has built in support for producing XML reports, which are easy to parse and therefore integrate with other tools.
What was not obvious, though, was exactly how to produce output with the right level of detail. The most promising parameters in the documentation were report_format and report_level, and indeed these can be used to produce XML — but even the detailed version does not output the reason when a test case fails. It turns out that assertion failures are reported in log output, and the log format can be tweaked to produce XML (reformatted for readability):
$ ./main --log_format=XML
<TestLog>
    <Error file="main.cpp" line="20">check add(2, 2) == 5 failed</Error>
    <Error file="main.cpp" line="25">check add(2, 2) == 1 failed</Error>
</TestLog>
To get output for passing tests, and for test suites, I also had to adjust the log_level to test_suite
$ ./main --log_format=XML --log_level=test_suite
<TestLog>
  <TestSuite name="PulseTest">
    <TestSuite name="VariantsSuite">
      <TestCase name="simplePass">
        <TestingTime>0</TestingTime>
      </TestCase>
      <TestCase name="checkFailure">
        <Error file="main.cpp" line="20">check add(2, 2) == 5 failed</Error>
        <TestingTime>0</TestingTime>
      </TestCase>
...
    </TestSuite>
  </TestSuite>
</TestLog>
Bingo! Now the XML output has all the details required to render the test results nicely in a continuous integration server, provided the server has a plugin to read the XML.
–
1 In my case obviously Pulse, but XML reports are likely to be the easiest way to integrate with other CI servers too.
C++ Unit Testing With Boost.Test
Recently I implemented a Pulse plugin to read Boost.Test reports and integrate the tests into the build results. As usual, the first step in implementing the plugin was the creation of a small project that uses Boost.Test to produce some real reports to work from. I found the Boost.Test documentation to be detailed, but not so easy to follow when just getting started — so I thought I’d give an overview here.
Step 1: Installation
First you will need to install Boost.Test, or possibly all of Boost if you plan to use more of it. You can download Boost in its entirety from the Boost download page. Then you just need to unpack the archive somewhere appropriate, so you can include the headers and link against built libraries (see the next step).
An even easier option if you are on Linux is to install a package. On Ubuntu (and, I expect, other Debian variants), the desired package is libboost-test-dev:
$ sudo apt-get install libboost-test-dev
The downside of this is the packages are somewhat out of date, the default being built from Boost 1.34.1 (there is also a 1.35 variant available). I have not seen much impact of this when using Boost.Test, but if you need newer Boost libraries then it may be better to compile your own.
Step 2: Choose Your Compilation Model
Unlike many Boost libraries (which are implemented completely as headers), Boost.Test includes a runtime component which you need to link against: the “Program Execution Monitor”. This component includes the main entry point for running your tests, among other things. If you installed Boost from source, you will need to build the library yourself using bjam — the instructions are quite toolchain specific so I won’t go into them here. You can link statically or dynamically, but will need to configure your includes and build appropriately.
The key thing from the point of view of writing and building your tests is to include the right definitions in your source and add the right flags when linking. I opted for dynamic linking against the prebuilt library installed by my Ubuntu package. To achieve this, I needed two things:
- To define BOOST_TEST_DYN_LINK before including the Boost.Test headers in my source file.
- The addition of: -lboost_unit_test_framework to my linker flags.
With that plumbing out of the way, we can get down to testing something.
Step 3: A First Test Case
For a start, I cooked up an exceptionally useful function to add two ints, and a test case “universeInOrder” to check that it works:
#define BOOST_TEST_DYN_LINK
#define BOOST_TEST_MODULE Hello
#include <boost/test/unit_test.hpp>
int add(int i, int j)
{
    return i + j;
}
BOOST_AUTO_TEST_CASE(universeInOrder)
{
    BOOST_CHECK(add(2, 2) == 4);
}
Notice that apart from the BOOST_TEST_DYN_LINK definition, I also had to define a name for my test module via BOOST_TEST_MODULE. The case itself is defined using the BOOST_AUTO_TEST_CASE macro, giving the case name as an argument1. Finally, within the test assertions can be made the BOOST_CHECK macro. Compiling and running the test gives the following:
$ g++ -ohello -lboost_unit_test_framework hello.cpp
$ ./hello
Running 1 test case...
*** No errors detected
Simple enough, my test passes. If I deliberately make it fail, by changing the 4 to a 5, I get:
 $ ./hello
Running 1 test case...
hello.cpp(12): error in "universeInOrder": check add(2, 2) == 5 failed
*** 1 failure detected in test suite "Hello"
Here we start to see the benefits of the library: I get a nice failure message, complete with line number and the expression that failed.
Step 4: More Assertions
Unlike the assertions in many testing libraries, a failed BOOST_CHECK will not exit the test case immediately — the problem is recorded and the case continues. To immediately fail a test, you can use BOOST_REQUIRE instead:
BOOST_AUTO_TEST_CASE(universeInOrder)
{
    BOOST_REQUIRE(add(2, 2) == 4);
}
To just output a warning instead of failing the test, you can use BOOST_WARN. In fact many Boost.Test assertions come in these three variants: CHECK, REQUIRE and WARN.
Richer assertions are also possible, including these notable examples:
- BOOST_CHECK_MESSAGE: allows you specify a custom failure message as a second argument. You can pass a string, or any type supporting the << operator.
- BOOST_CHECK_EQUAL: checks two arguments for equality using ==. Improves upon the normal check in the above examples by showing the actual values when the assertion fails.
- BOOST_CHECK_THROW: checks that an expression causes a specified type of exception to be thrown.
The full list of available assertions for the the version of Boost.Test I am using (1.34.1) can be found here.
Step 5: Suites
Once you have a non-trivial number of test cases, you need to organise them into suites. Note that each module (defined with BOOST_TEST_MODULE) already has a top-level suite named after that module. Further suites can be nested within a module to categorise as necessary. The easiest way to do this is to continue with the auto-registration model, and simply wrap the test cases with new macros to start and end a suite:
#define BOOST_TEST_DYN_LINK
#define BOOST_TEST_MODULE Suites
#include <boost/test/unit_test.hpp>
int add(int i, int j)
{
    return i + j;
}
BOOST_AUTO_TEST_SUITE(Maths)
BOOST_AUTO_TEST_CASE(universeInOrder)
{
    BOOST_CHECK(add(2, 2) == 4);
}
BOOST_AUTO_TEST_SUITE_END()
BOOST_AUTO_TEST_SUITE(Physics)
BOOST_AUTO_TEST_CASE(specialTheory)
{
    int e = 32;
    int m = 2;
    int c = 4;
    BOOST_CHECK(e == m * c * c);
}
BOOST_AUTO_TEST_SUITE_END()
In a normal run, you won’t see that the tests have been categorised. To show the suites in the output, you can set the log level to test_suite:
$ ./suites --log_level=test_suite
Running 2 test cases...
Entering test suite "Suites"
Entering test suite "Maths"
Entering test case "universeInOrder"
Leaving test case "universeInOrder"
Leaving test suite "Maths"
Entering test suite "Physics"
Entering test case "specialTheory"
Leaving test case "specialTheory"
Leaving test suite "Physics"
Leaving test suite "Suites"
*** No errors detected
Step 6: Fixtures
To add common setup and teardown code around your cases, Boost.Test supports fixtures. These take advantage of C++’s own mechanism for setup and teardown – construction and destruction. Indeed, you can easily add a “fixture” to a test case be just defining a type with the appropriate constructor and destructor and allocating one on the stack at the start of the case. This is repetitious, however, and not terribly explicit. From my experience the nicest way is to organise your tests into suites so that you can use one fixture per suite, and then just use BOOST_FIXTURE_TEST_SUITE in place of BOOST_AUTO_TEST_SUITE:
#define BOOST_TEST_DYN_LINK
#define BOOST_TEST_MODULE Fixtures
#include <boost/test/unit_test.hpp>
struct Massive
{
    int m;
    Massive() : m(2)
    {
        BOOST_TEST_MESSAGE("setup mass");
    }
    ~Massive()
    {
        BOOST_TEST_MESSAGE("teardown mass");
    }
};
BOOST_FIXTURE_TEST_SUITE(Physics, Massive)
BOOST_AUTO_TEST_CASE(specialTheory)
{
    int e = 32;
    int c = 4;
    BOOST_CHECK(e == m * c * c);
}
BOOST_AUTO_TEST_CASE(newton2)
{
    int f = 10;
    int a = 5;
    BOOST_CHECK(f == m * a);
}
BOOST_AUTO_TEST_SUITE_END()
Note that the test cases can refer directly to the public “m” member of the fixture type — in the background inheritance is at work, so protected members are also directly accessible. If you run this with logging, you can see that the fixture runs for each case:
$ ./fixtures --log_level=test_suite
Running 2 test cases...
Entering test suite "Fixtures"
Entering test suite "Physics"
Entering test case "specialTheory"
setup mass
teardown mass
Leaving test case "specialTheory"
Entering test case "newton2"
setup mass
teardown mass
Leaving test case "newton2"
Leaving test suite "Physics"
Leaving test suite "Fixtures"
*** No errors detected
Conclusion
I hope that gives you a decent starting point for using Boost.Test. As I mentioned in the beginning, there is plenty more documentation available at the source — it’s just daunting due to its size. Happy testing!
Update
Sample code is now available at GitHub.
–
1 – It is also possible to define free functions containing your tests and register them manually, although I find the automatic method simpler.
Caging Selenium With Xnest
Our automated acceptance test suite for Pulse makes heavy use of Selenium to test the web UI. The ability to automate real browsers is a godsend for testing DOM/JavaScript differences, but causes a few practical issues. Probably the most irritating of these is that running the test suite continually pops up browser windows which steal focus. Any sort of focus stealing is intolerable, but having focus stolen every 20 seconds for half an hour is downright maddening.
Luckily, in the wonderful world of X, there are a multitude of ways to solve this problem. One that immediately came to mind was to use Xvfb to run the tests headless on my development box, just as I had them running on our headless CI agents. The big drawback with this method, however, is the inability to peek at what the browser is doing. It is possible to take a screenshot and open that, but it feels a little clunky.
Enter Xnest. This is an X server that can run inside a window — effectively hosted by another X server. By pointing Selenium’s DISPLAY at such a nested server, you can cage it inside a window where it is easy to observe but can’t mess with your focus:
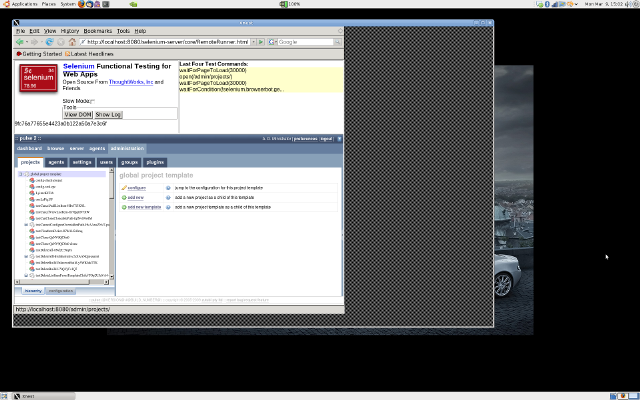
If you’d like to tame Selenium yourself, just follow the steps below. Installation commands are Ubuntu/Debian style, but should be easy to translate to other distributions:
- Install Xnest: the X server that runs inside a window:
$ sudo apt-get install xnest
- Install a simple window manager: any lightweight window manager will do. I chose fvwm as it has defaults that work fine for this case, and it reminds me of days past:
$ sudo apt-get install fvwm
- Start Xnest: choose an unused display number (most standard setups will already be using 0) — I chose 1. Note the -ac flag turns off access control, which you might want to be more careful about. The -display argument is the display the Xnest window will open in — you can skip this flag first time round but will need it if you start in a shell where DISPLAY is already set to something else:
$ Xnest :1 -display :0 -ac &
- Set DISPLAY: to get further X programs to connect to Xnest rather than your primary X server, you need to set the environment variable DISPLAY to :1 (or whatever you passed as the first argument to Xnest above):
$ export DISPLAY=:1
- Start your window manager: launch the lightweight manager you installed above to control windows in your nested X instance:
$ fvwm &
- Run your tests: however you normally would:
$ ant accept.master
Viola! You should now be able to watch your tests as they run, but contained completely within the Xnest window where they won’t interrupt your normal flow. Now if only my IDE would stop stealing my focus too…
Four Simple Rules For Mocking
Lately I’ve been thinking about how I approach mocking in my tests, and why it is that I like Mockito so much. I find that I follow a few simple rules:
- Don’t Mock: where possible, I prefer to use real implementations rather than mocks. Using real implementations is usually easier, is closer to reality (which is the ultimate test). So I only mock when real implementations are too hard to control, or too slow.
- Don’t Mock, Fake: if speed is the problem, instead of immediately reaching for a mock, I first consider if there is an alternative implementation. The classic example is an in-memory implementation of what would usually be a slow external resource (like a file system or database). This is a middle ground — close to reality, but fast enough to keep the test suite snappy.
- Don’t Mock, Stub: I prefer not to verify directly using mocks, as this risks testing the implementation of the unit rather than its interface. So even when using a mocking library, I prefer to stub behaviour and assert based on the output and state of the unit.
- OK, Mock: if I strike out on rules 1, 2 and 3, I know I’ve hit the sweet spot for full-blown mocking.
My conclusion is that although mocks are a powerful and necessary tool, my personal tendency is to avoid them until absolutely necessary. Even when I use mocks, I avoid verification where possible. This is why Mockito works so well — because it favours stubbing with selective verification over the classical expect-run-verify model.
Continuous Integration Myth: CI vs Nightly Builds
This particular myth was one I hadn’t anticipated, but I’ve seen variations repeated often enough to convince me that there is some confusion about the relationship between continuous integration and nightly (or indeed daily) builds.
The first point to clarify is that having a build that runs daily is not the same as practicing continuous integration. Daily is just not frequent enough — indeed the goal should be a new build for every change, or continual builds if the former is impossible. Add on top of that the fact that having a build server is not the same as CI, and it’s clear that we are talking about different beasts.
Where things get more interesting is when people start to ask questions like “Is there any value in a nightly build when you are already practicing CI?”. It may seem, if you’re building twenty times a day, that there’s little point building a twenty-first time overnight. But far from making a nightly build redundant, a CI setup can include nightly builds as a complement to the normal continuous builds. Let’s look at some common examples:
- Fast Build/Slow Build: larger projects can often develop a test suite that takes hours to run. Although the goal should be to cut this time down mercilessly, the reality is some forms of testing are slow. A common workaround is to split the slower tests out of the continuous build (to keep it fast), and run a nightly build with the full test suite.
- Nightly Releases: a build can be used to release a full package nightly based on the last known good revision. This is a good example of how the CI build complements the nightly — by identifying the most recent revision that passed all tests, making the nightly releases more reliable.
- Resource Intensive Builds: the idle hours in the night are a great time to run tests that require a lot of resources, as the build can make use of hardware that would normally be tied up during the day.
So, nightly builds are not CI, but at the same time a CI setup should not neglect nightlies altogether.
Continuous Integration Myth: A New Practice
With the recent increase in awareness of continuous integration, not to mention the ever-expanding number of tools in this space, it would be easy to think that it is a new practice. Actually, the practice has quite a long history with roots that go very deep considering the youth of software development as an industry.
The name “Continuous Integration” itself has been kicking around since the year 2000, when Fowler’s original article was published. This article certainly popularised the term, but also hints at the deeper history:
We are using the term Continuous Integration, a term used as one of the practices of XP (Extreme Programming). However we recognize that the practice has been around for a long time and is used by plenty of folks that would never consider XP for their work.
The updated version of Fowler’s article makes the somewhat cheeky claim:
The open source CruiseControl, the first continuous integration server, was originally created at ThoughtWorks.
There is no doubt that CruiseControl is a pioneering project in this space, but to claim it as the “first continuous integration server” is playing a little with semantics. It may have been the first project to use that label, but by the time CruiseControl was created there were already in-house tools that included all of the critical pieces. In my own personal experience I worked on a project which in 1999 had a server that built on every checkin, with a web UI and email notifications — not to mention that the tool behind it had been originated by my colleague at a previous job.
No doubt there are many more examples, likely much older, of projects using the core practices of continuous integration before we had a common term to describe it. Tracing their history is difficult — we’re talking pre-internet projects at closed shops here!
What is easier to find in earlier papers are references to daily builds. Take the McConnell classic Daily Build and Smoke Test, from 1996, which describes how daily builds were used at Microsoft. There is a key difference here: daily builds are not exactly continuous, and increasing the frequency is a core idea in the practice as we view it today. McConnell does, however, illustrate that frequency was seen as an important factor:
Some organizations build every week, rather than every day. The problem with this is that if the build is broken one week, you might go for several weeks before the next good build. When that happens, you lose virtually all of the benefit of frequent builds.
In truth, for a Microsoft project in those days building daily may have been as frequent as was practical. Consider McConnell’s reference to an even earlier Microsoft paper:
By the time it was released, Microsoft Windows NT 3.0 consisted of 5.6 million lines of code spread across 40,000 source files. A complete build took as many as 19 hours on several machines, but the NT development team still managed to build every day (Zachary, 1994). Far from being a nuisance, the NT team attributed much of its success on that huge project to their daily builds.
It’s likely that if building on every change was seen as possible, these projects would have evolved to do so quite quickly. I would even guess smaller projects at Microsoft and elsewhere had discovered this and were building as frequently as practical.
The most tantalising reference I found comes from our competitor Slava Imeshev, in a ViewTier presentation. Rumour has it that the real roots of the practice could date back much further:
Integration builds … supposedly introduced by IBM software team in early 60-s when developing OS/360
It’s unsubstantiated, but there are suggestions the build was run multiple times a day. Those familiar with Mythical Man Month can make what they will of the fact that the OS/360 project was Brook’s “inspiration”.
So despite the recent growth in this area, it’s fair to say that the roots of continuous integration lie decades behind us. In an industry with a history itself measured in decades, this makes continuous integration anything but a new practice!
—
Interested in continuous integration and want to try it today? Download Pulse and get a free license for your small team, open source project or evaluation!
You are currently browsing the archives for the Agile category.
Where Am I?


A little madness is the blog of Daniel Ostermeier and Jason Sankey. We are the founders of zutubi, a company based in Sydney, Australia that makes software for software developers.
Our flagship product is Pulse, an easy to use yet powerful and adaptable continuous integration server. We’d love you to try it free today!